Vallejo Refinery Emissions & Academic Performance Analysis
Quick Summary
- Using Vallejo as a case study, a student statistical analysis report found a correlation between poor academic scores and how close a school is to a refinery site.
Background
Communities of color are disproportionately zoned and selected as sites for fossil fuel infrastructure projects given how dangerous and unhealthy constant exposure is (Pellow, 2020). This is particularly evident in the cluster of refineries along the Bay Area coast, which are located near frontline communities and have been active as early as 1896–such as the Phillips 66 San Francisco Refinery–and can process up to 120,200 barrels of crude oil per day (California Energy Commission, 2023). Living near an oil refinery is a health hazard as the facilities are known to emit sulfur dioxide, a respiratory irritant, as well as other heavy pollutants linked to cancer (Khatatbeh et al., 2020).
Vallejo, one of the cities within the refinery buffer zone, has a poverty rate of 11.5% with 29.3% Hispanic, 23% Asian, and 18.3% Black residential demographic (U.S. Census Bureau, 2023). On CalEnviroScreen 4.0, Vallejo has a Pollution Burden Percentile ranging from mid-70s to high 90s, an Education score of around 70, and a Toxic Releases exposure rating of mid-60s; the most-affected areas in the city have a higher Black and Hispanic population (CalEnviroScreen 4.0). In order to create a baseline for this project, academic achievements will be measured using Vallejo City Unified School District’s 2018-2019 California Assessment of Student Performance and Progress (CAASPP) exam scores—a standardized test given to all 3rd to 11th graders statewide (CA Department of Education, 2023). Local refinery data was sourced from the Environmental Protection Agency’s Toxic Releases Inventory and Risk-Screening Environmental Indicators (EPA, 2023). This community portfolio aims to find potential sites for Toxic-metal Aerosol Real Time Analysis (TARTA) deployment, primarily focusing on schools as one of the largest sensitive receptors.
These 4 point plots show the mean percentage of standards not met for each tested Area in the English section of the CAASPP test. X is the school’s name and Y is the total mean score.
This stacked bar plot shows the RSEI Cancer Score for each refinery in the Vallejo area from the years 1990 to 2020, with X being the year and Y being the cancer score.
This stacked bar plot visualizes the percentage of standards not met for the grades with sufficient data, summarized across the entire Vallejo District. X is the students’ grade level and Y is the percentage of standards not met.
This stacked bar plot shows the percentage of standards not met for the grades with sufficient data across each school in the Vallejo District. In this case, X is the students’ grade level and Y is the percentage of standards not met with the school names as the facet wrap.


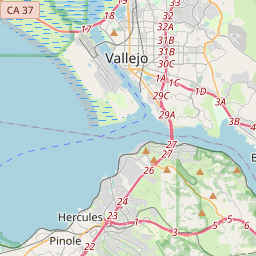
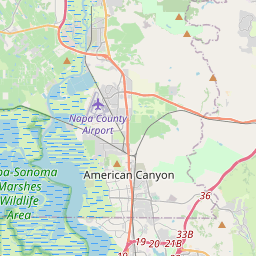
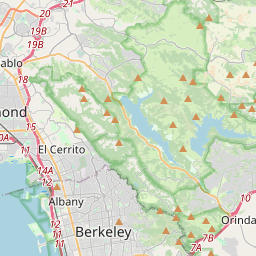
This interactive map, if you click on a blue point, illustrates the distance between each school and its nearest refinery (the red points), with some schools as close as 2.27 miles and the farthest being 7.27 miles. This is extremely concerning as living within 10 miles of an oil refinery has been associated with higher cancer risks (Williams et al., 2020). All of the refineries studied were reported to release nickel and nickel compounds, which are linked to lung and nasal cancer as well as pulmonary fibrosis (Morgan & Usher, 1994). Other refinery emissions known as polycyclic aromatic hydrocarbons, are associated with impacted neurological development, primarily in children (Katz et al., 2024).
This heat map shows the distance between each school in the Vallejo School District (X) and the refineries in the surrounding area (Y). Every school within the district is considerably closer to the Valero Benicia Refinery, Phillips 66 San Francisco Refinery, and NuStar Energy Refinery. The Valero Refinery RSEI score was 7423 and 53,899 in 2018 and 2019, respectively while the score for the Phillips 66 Refinery was 802 and 751 over the same time period.
This plot shows the Pearson correlation between distance of refineries and schools (X) and the percentage of standards not met (Y), with a p-value of 0.52 and r-value of 0.15. These findings indicate there is a positive correlation between the academic scores and refinery proximity.
For CAASPP scores and the RSEI score, the p-value (0.14), meaning there isn’t a significant relationship between the closest refinery’s RSEI score (X) and percentage of standards not met (Y).
Conclusion
Vallejo District’s CAASPP scores suggest that students struggled the most in meeting the standards for Area 1 and Area 2. Area 1 pertains to reading skills while Area 2 covers writing skills. For all tested areas, Solano Middle School and Vallejo High School consistently scored worse than Franklin Middle School, Hogan Middle School, and Jesse M. Bethel High School. As calculated in the nearest refinery data frame, Franklin Middle School is the closest to a refinery, as it is 3.7 miles away from Phillips 66 San Francisco Refinery while Solano Middle School is the farthest, 7.3 miles from the Phillips facility. Vallejo High School is in the middle of the two, 4.6 miles away from the Phillips refinery.
These findings can better inform community and political action directed towards mitigating and dismantling the fossil fuel industry’s impact on frontline communities. Access to safe education is an environmental justice issue, one that the Community Air Project seeks to address.
References
CA Department of Education. (2023). About CAASPP and ELPAC. CAASPP Reporting . https://caaspp-elpac.ets.org/caaspp/AboutCAASPP
CalEnviroScreen 4.0. ArcGIS Experience. (n.d.). https://experience.arcgis.com/experience/11d2f52282a54ceebcac7428e6184203/page/CalEnviroScreen-4_0/
California Energy Commission. (2023, October 12). California oil refinery history. https://www.energy.ca.gov/data-reports/energy-almanac/californias-petroleum-market/californias-oil-refineries/california-oil
Cannon, C. (2024, March 4). Community Air Research: Community Air. Community Air Research Community Air. https://communityair.ucdavis.edu/
Environmental Protection Agency. (2022, October). EasyRSEI Dashboard v2.3.11. EPA. https://edap.epa.gov/public/extensions/EasyRSEI/EasyRSEI.html
Environmental Protection Agency. (2023, May 3). EPA. https://www.epa.gov/rsei/tri-and-rsei-communities
Katz, J. K., Kay, J., & Katz, C. (2024, February 6). Pollution, poverty, and people of color: The factory on the Hill. EHN. https://www.ehn.org/pollution-poverty-richmond-2645503359.html#:~:text=Sulfates%20can%20be%20inhaled%20deep,spend%20most%20of%20their%20time.%22
Khatatbeh, M., Alzoubi, K., Khabour, O., & Al-Delaimy, W. (2020). Adverse health impacts of living near an oil refinery in Jordan. Environmental Health Insights, 14, 117863022098579. https://doi.org/10.1177/1178630220985794
Morgan, L. G., & Usher, V. (1994). Health problems associated with nickel refining and use*. The Annals of Occupational Hygiene. https://doi.org/10.1093/annhyg/38.2.189
Pellow, D. N. (2020). Environmental justice. Agenda For Social Justice 2020, 143–152. https://doi.org/10.2307/j.ctv14rmnsb.22
U.S. Census Bureau. (2023, July 1). U.S. Census Bureau quickfacts: Vallejo City, California. https://www.census.gov/quickfacts/fact/table/vallejocitycalifornia/INC110222
Williams, S. B., Shan, Y., Jazzar, U., Kerr, P. S., Okereke, I., Klimberg, V. S., Tyler, D. S., Putluri, N., Lopez, D. S., Prochaska, J. D., Elferink, C., Baillargeon, J. G., Kuo, Y.-F., & Mehta, H. B. (2020). Proximity to oil refineries and risk of cancer: A population-based analysis. JNCI Cancer Spectrum, 4(6). https://doi.org/10.1093/jncics/pkaa088
